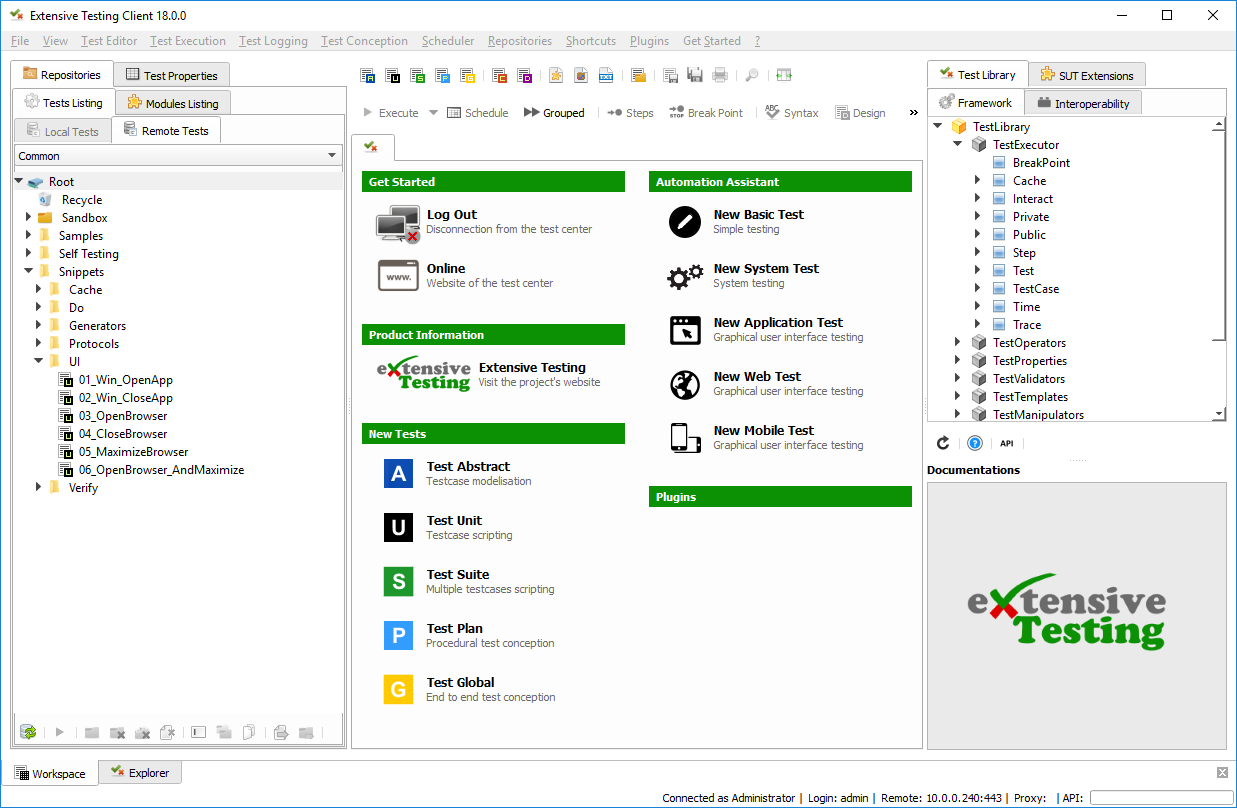
Client
The client allows to write and execute automatic tests but also to analyze the results in real time or deferred. It also allows you to share tests in a simple and effective way. To use the client, you must have a user account and be able to connect to the test server (tcp/443).
The client can also be used to develop extensions (adapters and libraries) to communicate with the system to be tested or piloted.
- Finally the graphical interface changes according to the level of access:
- tester level: write / execute tests, and analyze the results
- admin level: access to all features
- monitor level: read only access
- The interface is divided into 3 main parts:
- the workspace
- the analyzer
- the server explorer
Note
The client is available on Windows and Linux, in 64bits mode
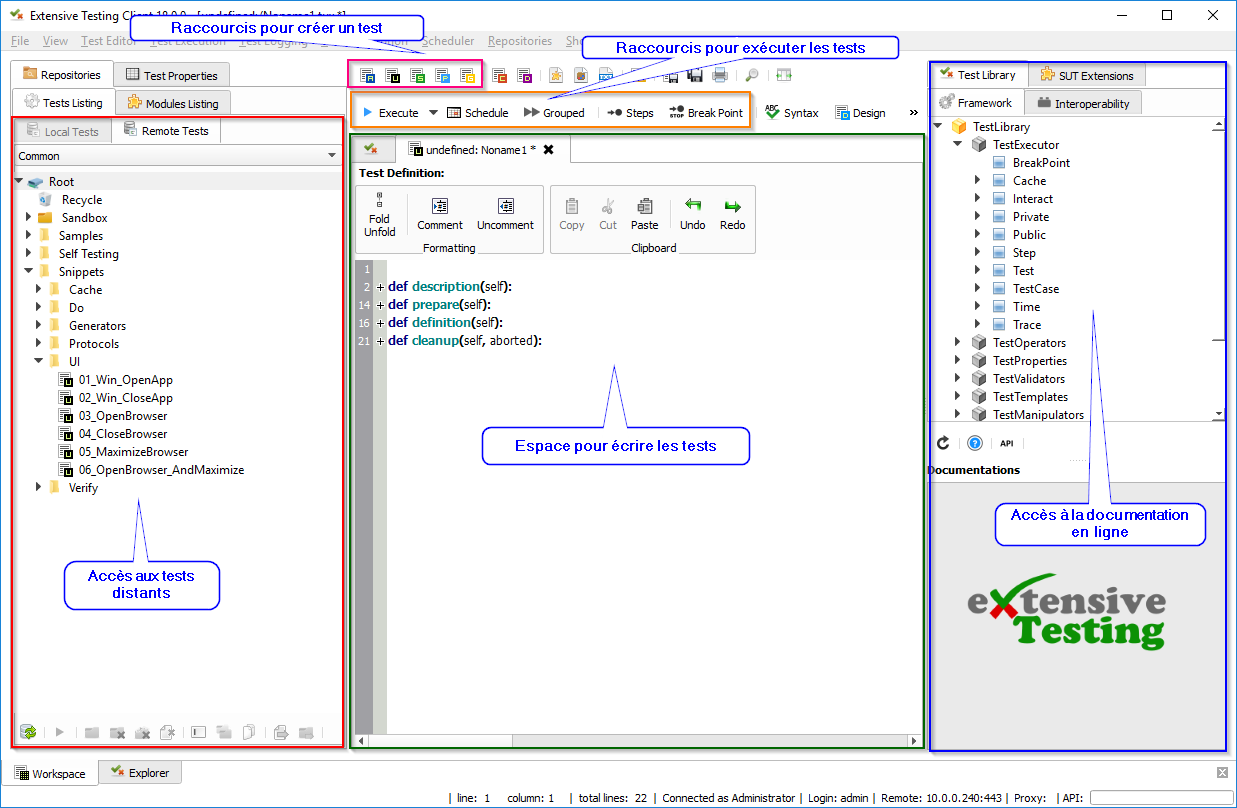
The workspace
- The workspace is composed of 3 main parts:
- access to all file repositories
- access to test design
- online documentation
Deposit of tests
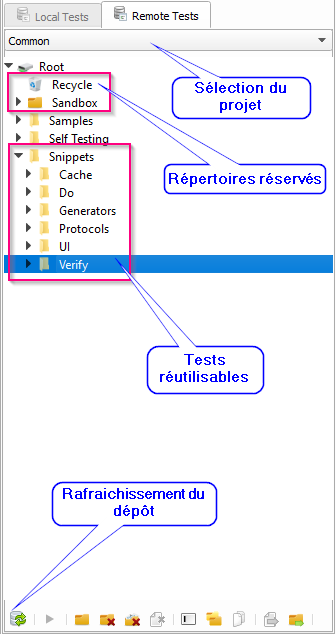
The client provides access to the two test repositories: remote and local.
The remote repository allows to store its tests on the test server, so to share them with other users.
The tree consists of files and directories. Test management can be done from the client.
The tests can be organized by project if necessary.
Note
The Common project contains re-usable tests and various examples.
Note
The directories Recycle and Sandbox are reserved directories, delete them is impossible.
Note
It is possible to open a test by dragging and dropping the file to the writing space.
The local repository gives the possibility to store his tests on his post, so not shared. This feature is not enabled by default because it is not in the philosophy of the solution to use it. Nevertheless the deposit can be activated through the user’s preferences.
Warning
Some features are missing in the local repository, its use is not recommended!
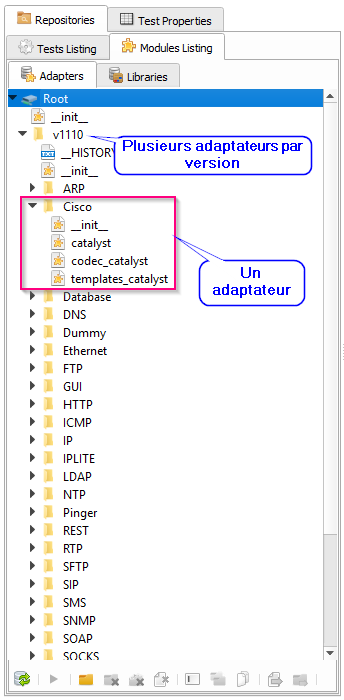
Depositing extensions
The client allows access to the depots of the extensions (adapters and libraries) and can also be used to develop new ones, which will be stored there too. These extensions are organized by version.
Note
The extensions are developed in Python.
Tests properties
The tests can be enriched with a number of properties. Available properties are:
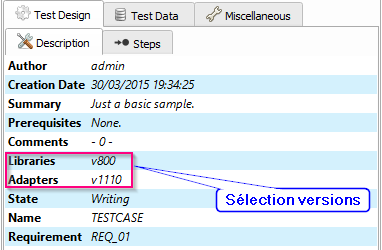
- the description of the test (author, date of creation, etc …)
- incoming and outgoing variables
- the definition of agents and probes used by the test
The Test properties> Test Data> Inputs window contains the list of variables accessible from the test.
Adding variables can be done by right clicking ‘Add parameter’.
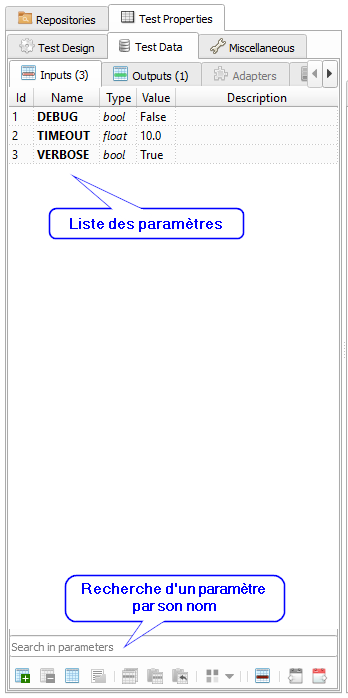
Note
To insert a parameter into a test, just drag & drop.
Note
It is possible to choose the version of the adapters and libraries to use for the test
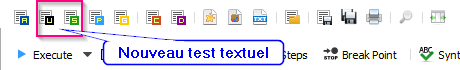
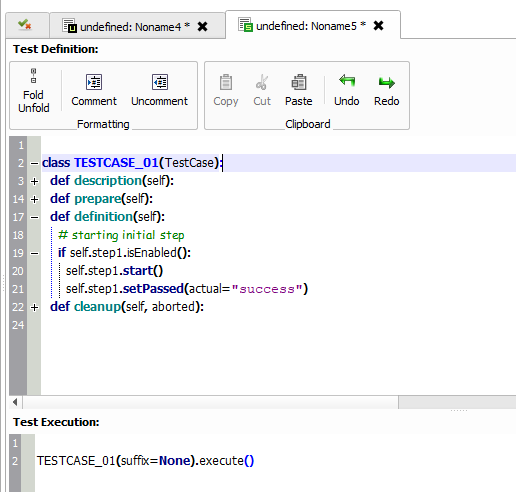
Textual design
The design of a scripting test is possible with unit and suite.
This design mode requires knowledge in development, i.e. python.
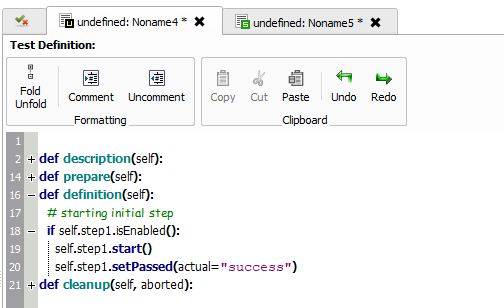
The unit test is a test case. It is divided into 4 sections automatically called by the framework.
The suite test represents one or more test cases. This type of test allows you to run the same
test case by changing the input parameters.
Note
The Ctrl + F shortcut allows you to search for text in your tests.
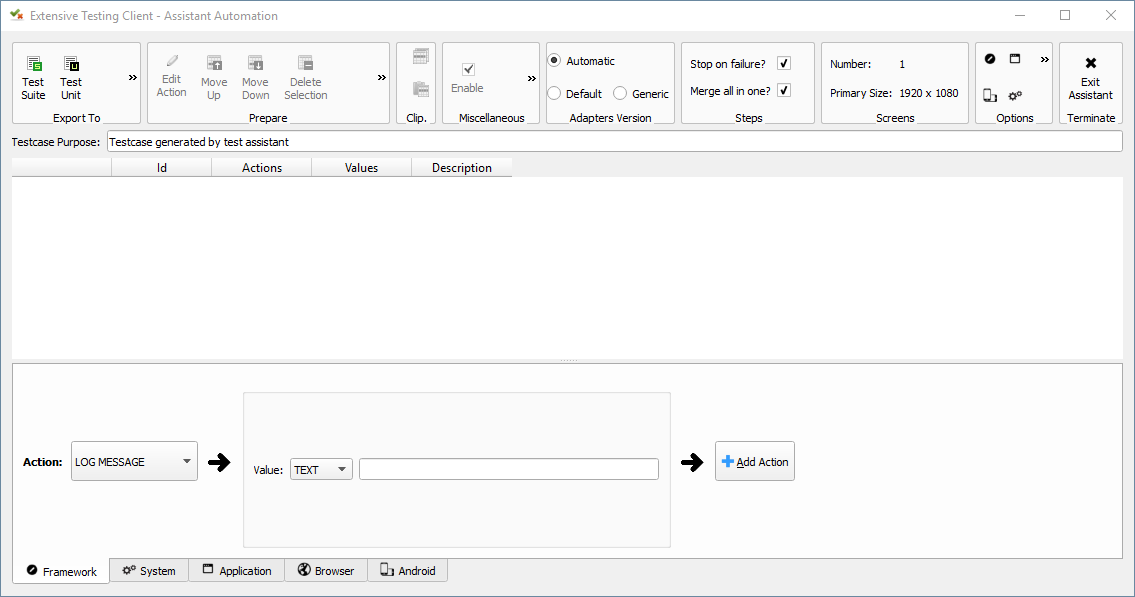
Assisted design
The design wizard allows you to write tests without knowledge in development. It covers the following actions:
- Call to the basic functions of the test framework
- SSH test
- Application test with screenshot (based on the Sikuli project)
- Website test (based on the Selenium project)
- Android mobile app test
The wizard is to describe the actions to perform, and if desired export them to a test unit or suite.
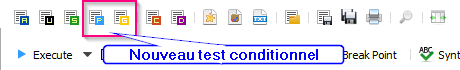
Conditional design
Conditional design allows you to build scenarios or test campaigns.
This approach does not require developing knowledge.
To perform this type of test, it is necessary to create a new plan or global test.
The test plan makes it possible to write test scenarios by including tests of the type unit or suite.
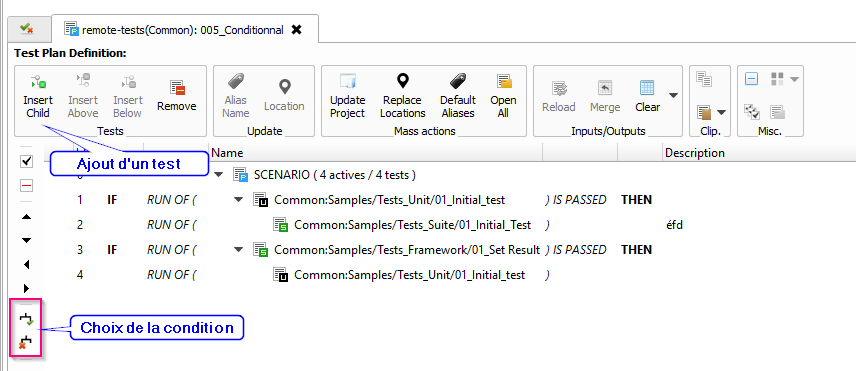
The global test is used to describe test campaigns by including tests plan, unit or suite.
Note
It is possible to override the test parameters.
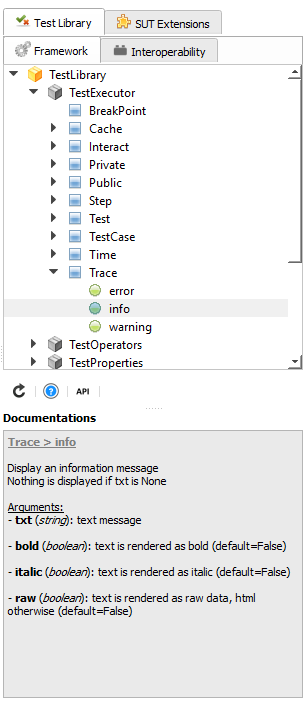
Online documentations
The online documentation is generated by the server, it describes the set of available functions in the test framework and the different extensions.
Note
A drag & drop from the documentation on a test automatically inserts the skeleton of the function.
The analyzer
The analyzer makes it possible to follow the execution of a test in real time or deferred. It makes it possible to display all the events of the test and to facilitate the analysis of the errors.
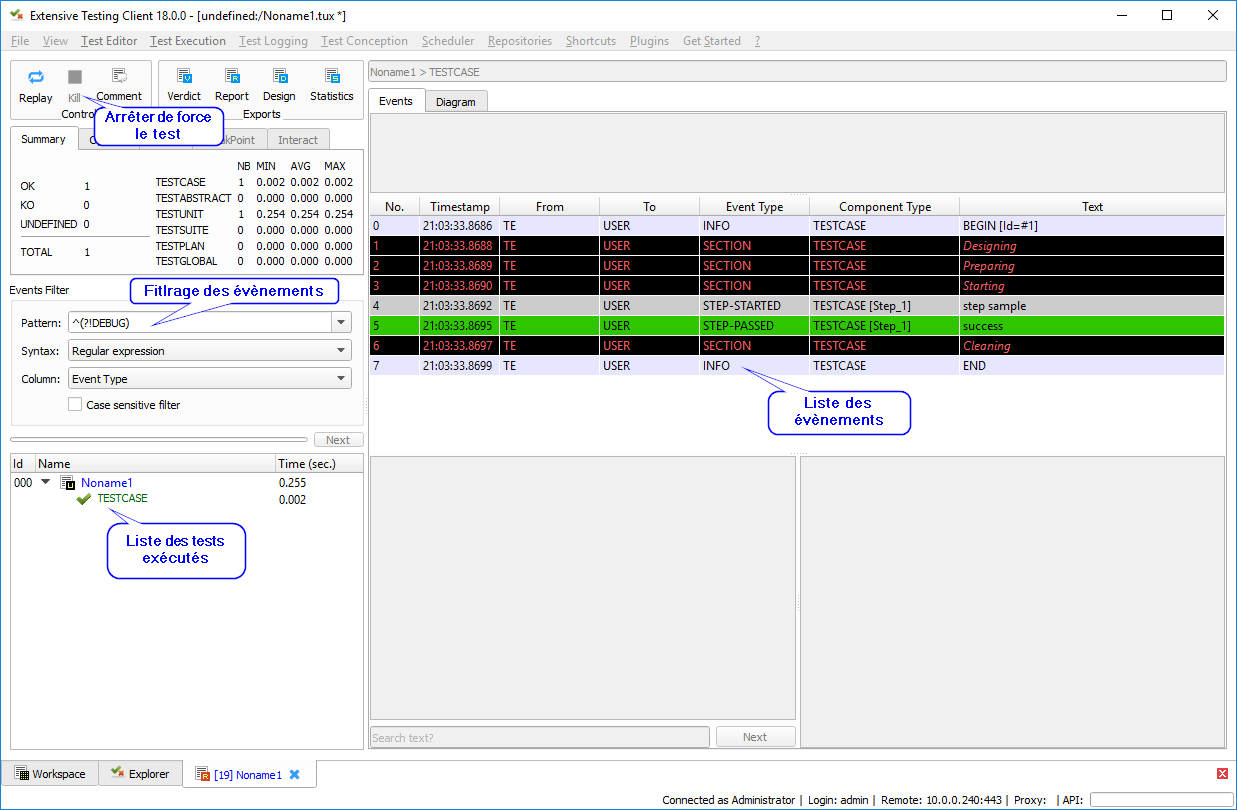
Visualization of events
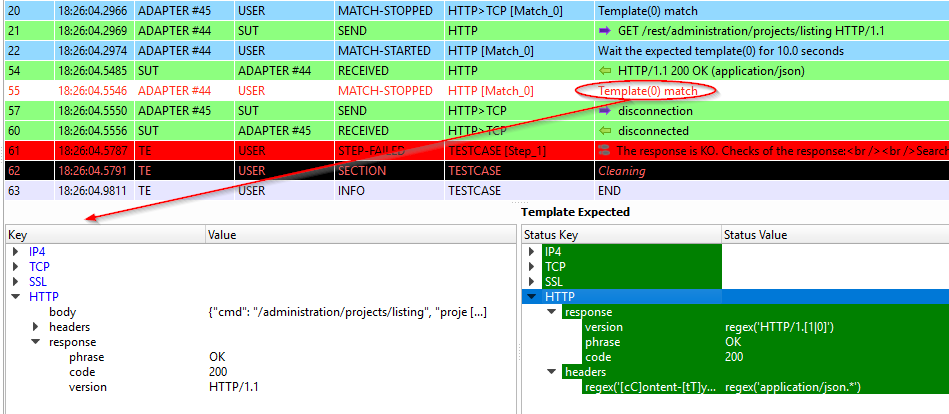
Different types of events are possible (column event type):
- DEBUG
- INFO
- WARNING
- ERROR
- SEND
- RECEIVED
- STEP-STARTED
- STEP-PASSED
- STEP-FAILED
- MATCH-STARTED
- MATCH-INFO
- MATCH-STOPPED
- MATCH-EXCEEDED
Note
Filtering on the ERROR event allows you to quickly see why the test is in error.
Note
The SEND | RECEIVED filter is used to display messages sent or received by the system to be tested / piloted.
Detailed view
Selecting an event from the list displays the detailed view. The detailed view displays the content of the event and more.
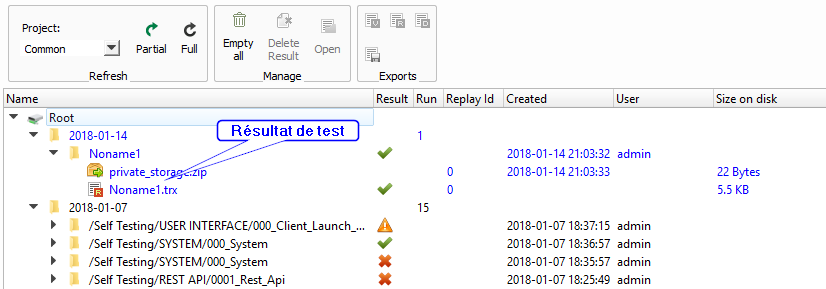
Server Explorer
Visualization of the results
The complete history of test results is available from the client. They are sorted by date and time of execution. The client can display the reports and download the logs generated during the execution of the test.
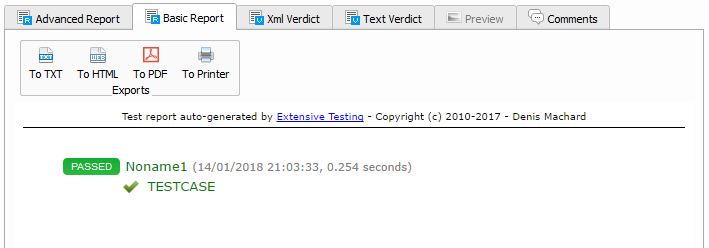
Visualization of test reports
Test reports are visible directly from the client. Two types of reports are available:
- advanced report
- simple report
Note
The reports are exportable in html, xml and csv formats.
Settings
Client behavior can be changed through the user’s preferences.
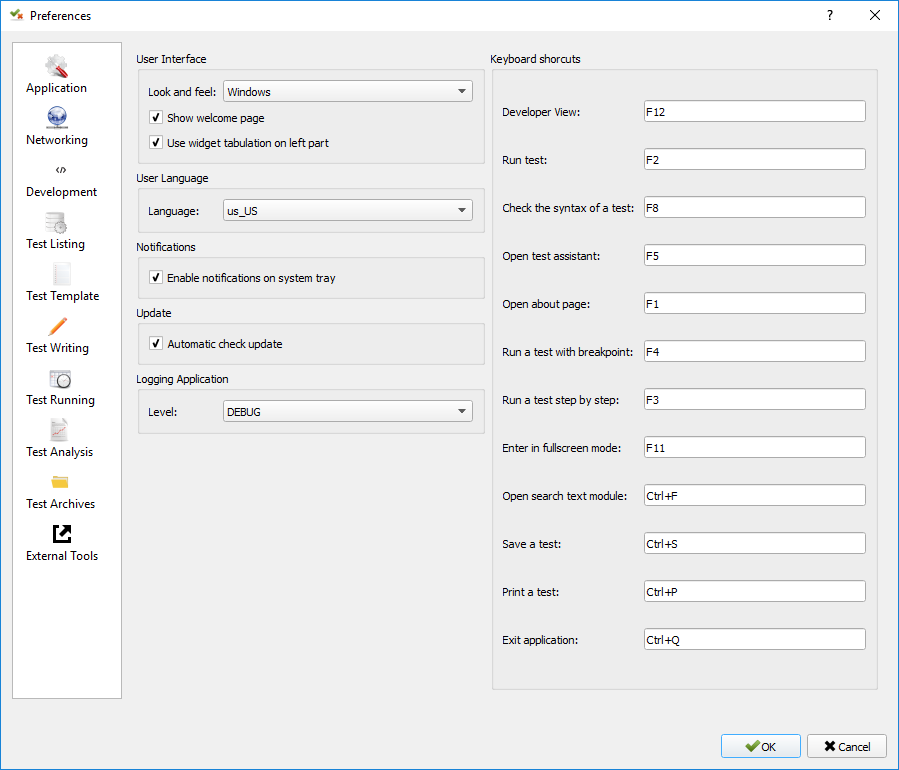
Note
Preferences are stored in the settings.ini file.
Complements
It is possible to add plugins in the client. Plugins are to be added to the Plugins directory.
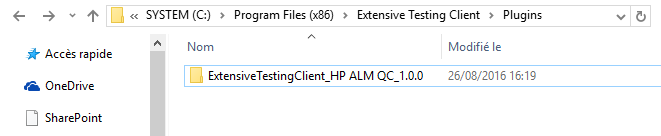
Plugins are accessible in the Plugins menu after restarting the client.
Note
It is necessary to restart the client to take into account the plugins deployed.
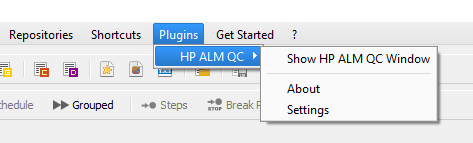
HP ALM plugin
The HP ALM plugin allows you to export tests and results from the Extensive Client to HP ALM QualityCenter.
This approach makes it possible to be independent with respect to QC.
- The configuration of the plugin is done in the page `` Settings``, it is necessary to configure at least:
- username
- the password
- the domain
- the project
To export a test, you must generate the test design from the client and click on the HP ALM plugin available on the toolbar.
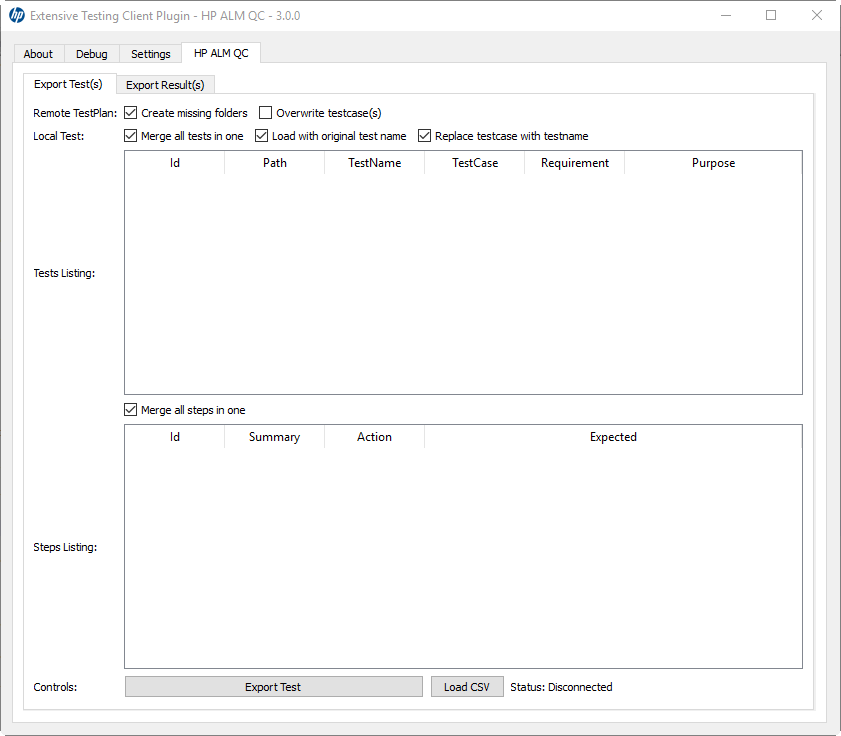
The export of the results can be done from the archive exploration window, The plugin must be available in the toolbar when a test report is loaded.
Note
The plugin is compatible with an HP ALM QC> = 12, the REST API is used.
Jenkins plugin
The Jenkins plugin does not do much in this version … It just provides a link to the web interface of its favorite Jenkins.
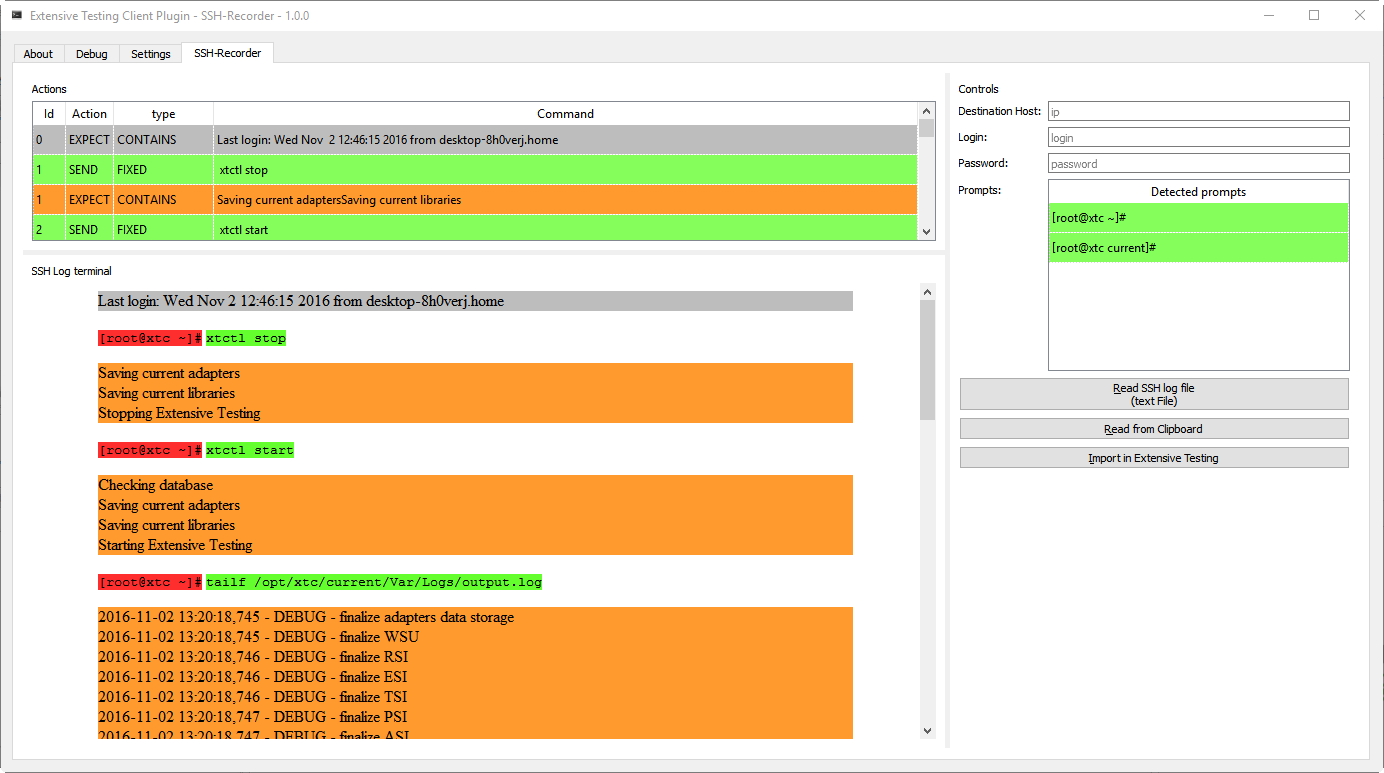
Shell Recorder Plugin
The Shell Recorder plugin allows you to import a sequence of shell commands into the design wizard and generate the associated test.
It allows to replay easily a sequence of commands.
The first step is to import an ssh session (from a putty terminal for example) from the clipboard or by directly importing a text file containing the sequence of shell commands.
The plugin automatically detects the prompt in the sequence to parse the associated commands and results. If the prompt is not detected, it can be changed manually.
SeleniumIDE Plugin
The use of the SeleniumIDE plugin involves basic use. It can convert a file saved with the SeleniumIDE plugin of firefox
in the design assistant.
Tip
It is more efficient to use the live assistant to be in tune with the philosophy of the solution.